twistpy.polarization.TimeDomainAnalysis3C#
- class TimeDomainAnalysis3C(N: Trace, E: Trace, Z: Trace, window: dict, verbose: bool = True, timeaxis: str = 'utc')[source]#
Time domain three-component polarization analysis.
Single-station three-component polarization analysis in the time domain. Polarization analysis is performed in a sliding time window using the complex analytic signal [1].
[1] Vidale, J. E. (1986). Complex polarization analysis of particle motion, BSSA, 76(5), https://doi.org/10.1785/BSSA0760051393
Note
It is recommended to bandpass filter the data to a narrow frequency band before attempting a time-domain polarization analysis in order to avoid that dispersion effects and wave type interference affect the polarization.
- Parameters
- N
Trace North component seismogram
- E
Trace East component seismogram
- Z
Trace Vertical component seismogram
- window
dict Window parameters defined as:
- verbose
bool, default=True Run in verbose mode.
- timeaxis
str, default=’utc’ Specify whether the time axis of plots is shown in UTC (timeaxis=’utc’) or in seconds relative to the first sample (timeaxis=’rel’).
- N
- Attributes
- t_windows
listofUTCDateTime Window positions of the sliding time window on the time axis (center point of the window)
- C
ndarrayofcomplex128 Complex covariance matrices at each window position
- time
listofUTCDateTime Time axis of the input traces
- delta
float Sampling interval of the input data in seconds
- window_length_samples
int Window length in samples.
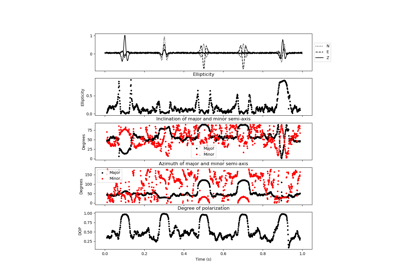
- dop
numpy.ndarrayoffloat Degree of polarization estimated at each window position.
Hint
The definition of the degree of polarization follows the one from Samson & Olson (1980): Some comments on the descriptions of the polarization states of waves, Geophysical Journal of the Royal Astronomical Society, https://doi.org/10.1111/j.1365-246X.1980.tb04308.x. It is defined as:
\[P^2=\sum_{j,k=1}^{n}(\lambda_j-\lambda_k)^2/[2(n-1)(\sum_{j=1}^{n}(\lambda_j)^2)]\]where \(P^2\) is the degree of polarization and \(\lambda_j\) are the eigenvalues of the covariance matrix.
- elli
numpy.ndarrayoffloat Ellipticity estimated at each window position
- inc1
numpy.ndarrayoffloat Inclination of the major semi-axis of the polarization ellipse estimated at each window position
- inc2
numpy.ndarrayoffloat Inclination of the minor semi-axis of the polarization ellipse estimated at each window position
- azi1
numpy.ndarrayoffloat Azimuth of the major semi-axis of the polarization ellipse estimated at each window position
- azi2
numpy.ndarrayoffloat Azimuth of the minor semi-axis of the polarization ellipse estimated at each window position
- t_windows
Methods
filter([suppress, smooth_mask, ...])Filter data based on polarization attributes.
plot([show, alpha, seismograms])Plot polarization analysis.
Perform polarization analysis.
save(name)Save the current TimeDomainAnalysis3C object to a file on the disk in the current working directory.
Examples using twistpy.polarization.TimeDomainAnalysis3C#
3-C Polarization analysis and filtering in the time domain