twistpy.polarization.TimeFrequencyAnalysis3C#
- class TimeFrequencyAnalysis3C(N: Trace, E: Trace, Z: Trace, window: dict, dsfacf: int = 1, dsfact: int = 1, frange: Optional[Tuple[float, float]] = None, trange: Optional[Tuple[UTCDateTime, UTCDateTime]] = None, k: float = 1, verbose: bool = True, timeaxis: str = 'utc')[source]#
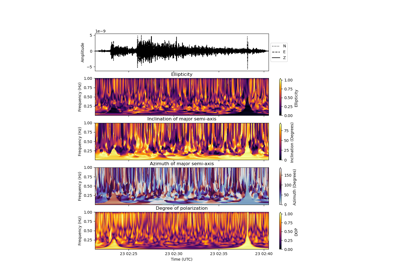
Time-frequency domain three-component polarization analysis.
Single-station three-component polarization analysis on time-frequency decomposed signals. The time-frequency representation is obtained via the S-transform (
twistpy.utils.s_transform).- Parameters
- N
Trace North component seismogram
- E
Trace East component seismogram
- Z
Trace Vertical component seismogram
- window
dict 2-D time-frequency window within which the covariance matrices are averaged:
- dsfact
int, default=1 Down-sampling factor of the time-axis prior to the computation of polarization attributes.
- dsfacf
int, default=1 Down-sampling factor of the frequency-axis prior to the computation of polarization attributes.
Warning
Downsampling of the frequency axis (dsfacf > 1) prevents the accurate computation of the inverse S-transform! Down-sampling should be avoided for filtering applications.
- frange
tuple, (f_min, f_max) Limit the analysis to the specified frequency band in Hz
- trange
tuple, (t_min, t_max) Limit the analysis to the specified time window. t_min and t_max should either be specified as a tuple of two
UTCDateTimeobjects (if timeaxis=’utc’), or as a tuple offloat(if timeaxis=’rel’).- k
float, default=1. k-value used in the S-transform, corresponding to a scaling factor that controls the number of oscillations in the Gaussian window. When k increases, the frequency resolution increases, with a corresponding loss of time resolution.
See also
twistpy.utils.s_transform- verbose
bool, default=True Run in verbose mode.
- timeaxis:obj:’str’, default=’utc’
Specify whether the time axis of plots is shown in UTC (timeaxis=’utc’) or in seconds relative to the first sample (timeaxis=’rel’).
- N
- Attributes
- t_pol
listofUTCDateTime Time axis of the computed polarization attributes.
- f_pol
ndarrayoffloat Frequency axis of the computed polarization attributes.
- C
ndarrayofcomplex128 Complex covariance matrices at each window position
- time
listofUTCDateTime Time axis of the input traces
- delta
float Sampling interval of the input data in seconds
- dop2D
numpy.ndarrayoffloat Degree of polarization estimated at each window position in time and frequency.
Hint
The definition of the degree of polarization follows the one from Samson & Olson (1980): Some comments on the descriptions of the polarization states of waves, Geophysical Journal of the Royal Astronomical Society, https://doi.org/10.1111/j.1365-246X.1980.tb04308.x. It is defined as:
\[P^2=\sum_{j,k=1}^{n}(\lambda_j-\lambda_k)^2/[2(n-1)(\sum_{j=1}^{n}(\lambda_j)^2)]\]where \(P^2\) is the degree of polarization and \(\lambda_j\) are the eigenvalues of the covariance matrix.
- elli2D
numpy.ndarrayoffloat Ellipticity estimated at each window position
- inc12D
numpy.ndarrayoffloat Inclination of the major semi-axis of the polarization ellipse estimated at each window position
- inc22D
numpy.ndarrayoffloat Inclination of the minor semi-axis of the polarization ellipse estimated at each window position
- azi12D
numpy.ndarrayoffloat Azimuth of the major semi-axis of the polarization ellipse estimated at each window position
- azi22D
numpy.ndarrayoffloat Azimuth of the minor semi-axis of the polarization ellipse estimated at each window position
- t_pol
Methods
filter([plot_filtered_attributes, suppress, ...])Filter data based on polarization attributes.
plot([clip, major_semi_axis, show, alpha, ...])Plot polarization analysis.
Perform polarization analysis.
save(name)Save the current TimeFrequencyAnalaysis3C object to a file on the disk in the current working directory.
Examples using twistpy.polarization.TimeFrequencyAnalysis3C#

3-C Polarization analysis and filtering in the time-frequency domain
3-C Polarization analysis and filtering: Real data example using a marsquake recorded by InSight